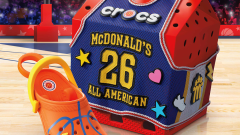
The 2026 McDonald’s All American Games, which pits the nation’s best high school basketball players against one another, tips off at Desert Diamond Arena in…
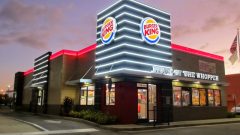
For a chain that practically invented fast-food value, McDonald’s seems determined to prove it still has the formula. According to a report from The Wall…
Sinners, the vampire-filled horror flick set in 1932 Mississippi, took home four Oscars last night at the 98th Academy Awards, with lead actor Michael B.…
Goldfish is working its magic once again. The snack brand has teamed with Warner Bros. to re-release Harry Potter-inspired Butterbeer Flavored Grahams. Arriving in time…
Jollibee Foods Corporation is expanding its global restaurant empire once again, this time by stepping into the booming hot pot market. The Filipino fast-food giant…
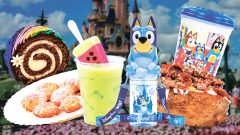
Bluey, the uber-popular cartoon about a family of talking dogs, is landing at Disneyland Resort on March 22 for “Bluey’s Best Day Ever!” The fun-filled…
Gabriel “Fluffy” Iglesias is entering the spirits industry with a “little fine” tequila. The legendary stand-up comic has teamed with Next Century Spirits to launch…
The non-alcoholic beer boom isn’t slowing down anytime soon, and Heineken is making another push to stay ahead of it. The brand just introduced Heineken…